Monday, August 3, 2020

The false claims of the #blacklivesmatter narrative

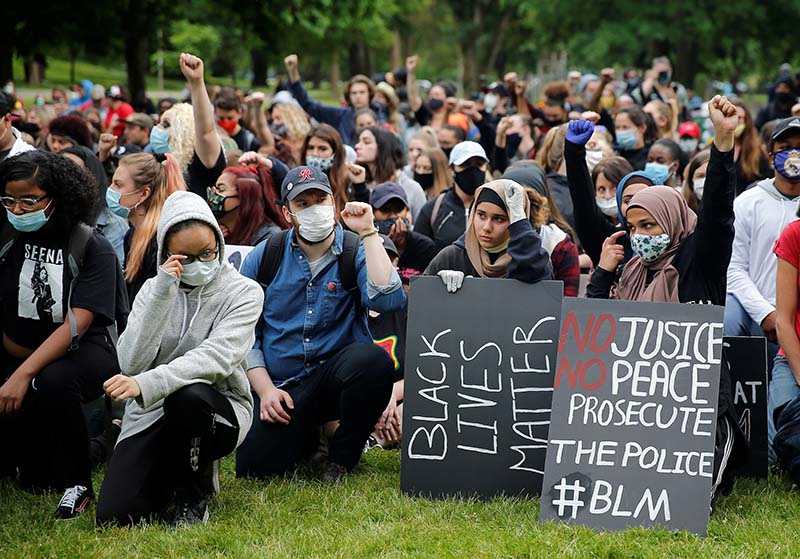
Black lives matter protesters kneeling


What you think you know about racially-motivated profiling, harassment, and use of deadly force by the police is probably wrong. It's understandable that when you watch a horrifying video of someone dying while being detained by police it immediately triggers strong emotions, but if you take a step back emotionally and consider the larger story about systemic racism being told by Black Lives Matters and others, you'll discover that it's not true. Worse, it's dangerous to race relations and civil society, as we've witnessed over the last couple months of rioting.

In the current climate, when passions substitute for reasoned discussion, it's important to recognize that the truth is often upsetting, especially when it repudiates a narrative that you believe and feel strongly about. Social media and mainstream media have inflamed those passions and anyone who argues against the narrative is called racist, is denounced, cancelled, or doxed. Calling people names ("racist!") is the lowest level of the hierarchy of disagreement (from the essay by Paul Graham about "How to Disagree"). It's childish; something that thoughtful, self-correcting, disciplined people grow out of as they mature. Unfortunately, it's the main mode of argument in the media today.


The Truth about Crime, Race, and Policing


If you're willing to consider a refutation of the central points of the Black Lives Matters movement, Heather Mac Donald makes a compelling case, backed up with studies and crime and policing data. Her central argument is that "police activity must be measured against crime, not population ratios."

BLM and their sympathizers measure police activity by population ratios so it looks like black people are being disproportionately targeted. What they neglect to mention is that, based on decades of crime data, black men also disproportionately commit violent crimes. The sad truth is that, almost exclusively, blacks are also the victims of those violent crimes; a glaring, tragic fact that Black Lives Matters and their ilk always ignore.

When confronted with this inconvenient truth, race-baiters claim that the data is wrong because black men are arrested and convicted of crimes more often than, for example, white men; and the reason for that, they say once again, is systemic racial bias by law enforcement. If that were true, crime would be rampant in white communities, but in fact the opposite is true. It is inner-city, minority-dominated communities that have the highest rates of violent crime. Accepting this fact is the beginning of understanding what the real solutions to the disparity in crime between racial and ethnic groups might be.

"Defunding the police," which charitably means "reallocating or redirecting funding away from the police department to other government agencies funded by the local municipality" as many have suggested, would make the problem far worse, as is almost invariably the case with Leftist thought experiments when turned into policy. Decades of crime data show that, for example the "broken windows" policy of policing advocated by former New York Mayor Rudy Giuliani and increasing police forces reduces crime (see here).

Here are several links to Heather Mac Donald's testimony, articles, and video which go into detail about the points summarized above.

Webcast for the AmericanExperimentMN, July 30, 2020:

Testimony delivered to the House Judiciary Committee Oversight Hearing on Policing Practices and Law Enforcement Accountability, June 10, 2020 (link to hearing here):

    Testimony at House Judiciary Committee Oversight Hearing on Policing Practices, September 19, 2019 (link to hearing here):

    Here is one of the many studies that Heather Mac Donald refers to:


    When you look at the FBI crime data and the socioeconomic data, the reasons for the large disparity in crime rates begin to suggest themselves; factors like high percentage of single-family homes without a father, high unwed pregnancy rates, high drug use, low educational achievement; all of which contribute to higher rates of poverty. These factors are common to areas of high crime regardless of race or ethnicity. Leftists suggest that reducing poverty would reduce crime because there is an obvious correlation, but they fail to notice that poverty is a symptom of poor choices, not just something you accidentally get, like an infection, and that crime is also a symptom of poor choices. Solving the underlying cycle of poor choices is the best cure for the inevitable results of those poor choices.

    Bill Cosby, before his own poor choices shackled him, was a vocal advocate for making cultural and personal changes in inner-city communities to end the cycle of poverty and violence.

    Here are some links to crime data.


    The Expanded Homicide Data Tables shows data broken down by race, ethnicity, and gender:


    Systemic racism in the U.S. today is (almost) non-existent


    While adding #blacklivesmatter to a social media post is intended to express someone's anger at the supposed widespread and systemic oppression, persecution, and disenfranchisement of the black community, it instead continues to spread the false narrative that any of this is really happening. Reviewing the links above will show that none of this is true.

    Certainly there are jerks who treat others badly, even in law enforcement, but they are few. Calling them "racists" feeds the false narrative of BLM and others that there is widespread racism in the U.S. today. In fact, the perpetrators are simply jerks. And when they are caught, they are prosecuted, as has happened to several police officers who abused their position. That's the beauty of having laws and enforcing them. Letting the legal system work to punish perpetrators is far better for civil society—to protect people, their property, and their freedoms—than letting mobs judge and punish.

    There are laws against racism in the U.S. and the systemic racism in government at many levels and in many states that existed until the 1960's was long ago purged with the passage of the Civil Rights Act of 1964. We live in a time of vastly improved race relations, and the situation continues to improve every year. It has happened because Americans are increasingly racially diverse and more tolerant of each other. Even during the worst periods of exploitation of black people in the era of Southern Slavery and the Jim Crow South (both of which were supported and defended by the Democratic Party of the time), most Americans were against slavery and racism.

    The reduction in racism and improvement in race relations in recent decades didn't come from the efforts of recently "woke" so-called "social justice warriors". It was happening long before they proclaimed themselves the modern-day saviors of racial minorities. In fact, the selective outrage of the Leftist mob that sees racism, sexism, homophobia, xenophobia, and bigotry everywhere—even (mostly) where there is no evidence of it; simply a difference of opinions—has actually caused a deterioration of race relations, and their call to have a "national conversation" about whatever is the topic de jour is actually the opposite and has worsened civil discourse. What they mean by "national conversation" is a one-sided lecture. It's not a "conversation" when one side shouts down the other and refuses to listen to their legitimate objections. Leftists and the Democratic Party use racism as a way to inflame passions and attract voters. It's another sad chapter in the exploitation of black Americans, something the Democratic Party has been doing ever since its founding. It's also evidence of the frequent implicit bias of Leftists who project their own racism onto others, as Ami Horowitz has demonstrated in his video "How white liberals really view black voters" (see here).

    If you weren't already aware of the way Democrats distort, slander, and lie about the views of Americans who oppose their exploitation of race relations, have a look at the way Candace Owens was treated and misquoted by them in a House hearing:


    For several minutes Democrats distort and lie about what Candace Owens said, then when she is allowed to respond (see here), Chairman Jerrold Nadler once again distorts what she says.

    The mainstream media is complicit in these distortions. If you take what the mainstream media reports at face value you are seriously misinformed. They have increasingly cast aside all pretense of neutrality and spin their reporting to suit the narrative of the Democratic Party, of which most of the media are either members or are sympathetic to their platform.

    Black Lives Matter Exposed


    Many people who sympathize with #blacklivesmatter probably don't hold the views of the formal Black Lives Matter organization, but they also probably don't know what those views are.


    Here are some videos


    Tuesday, November 19, 2019

    Climate science: models versus measurements

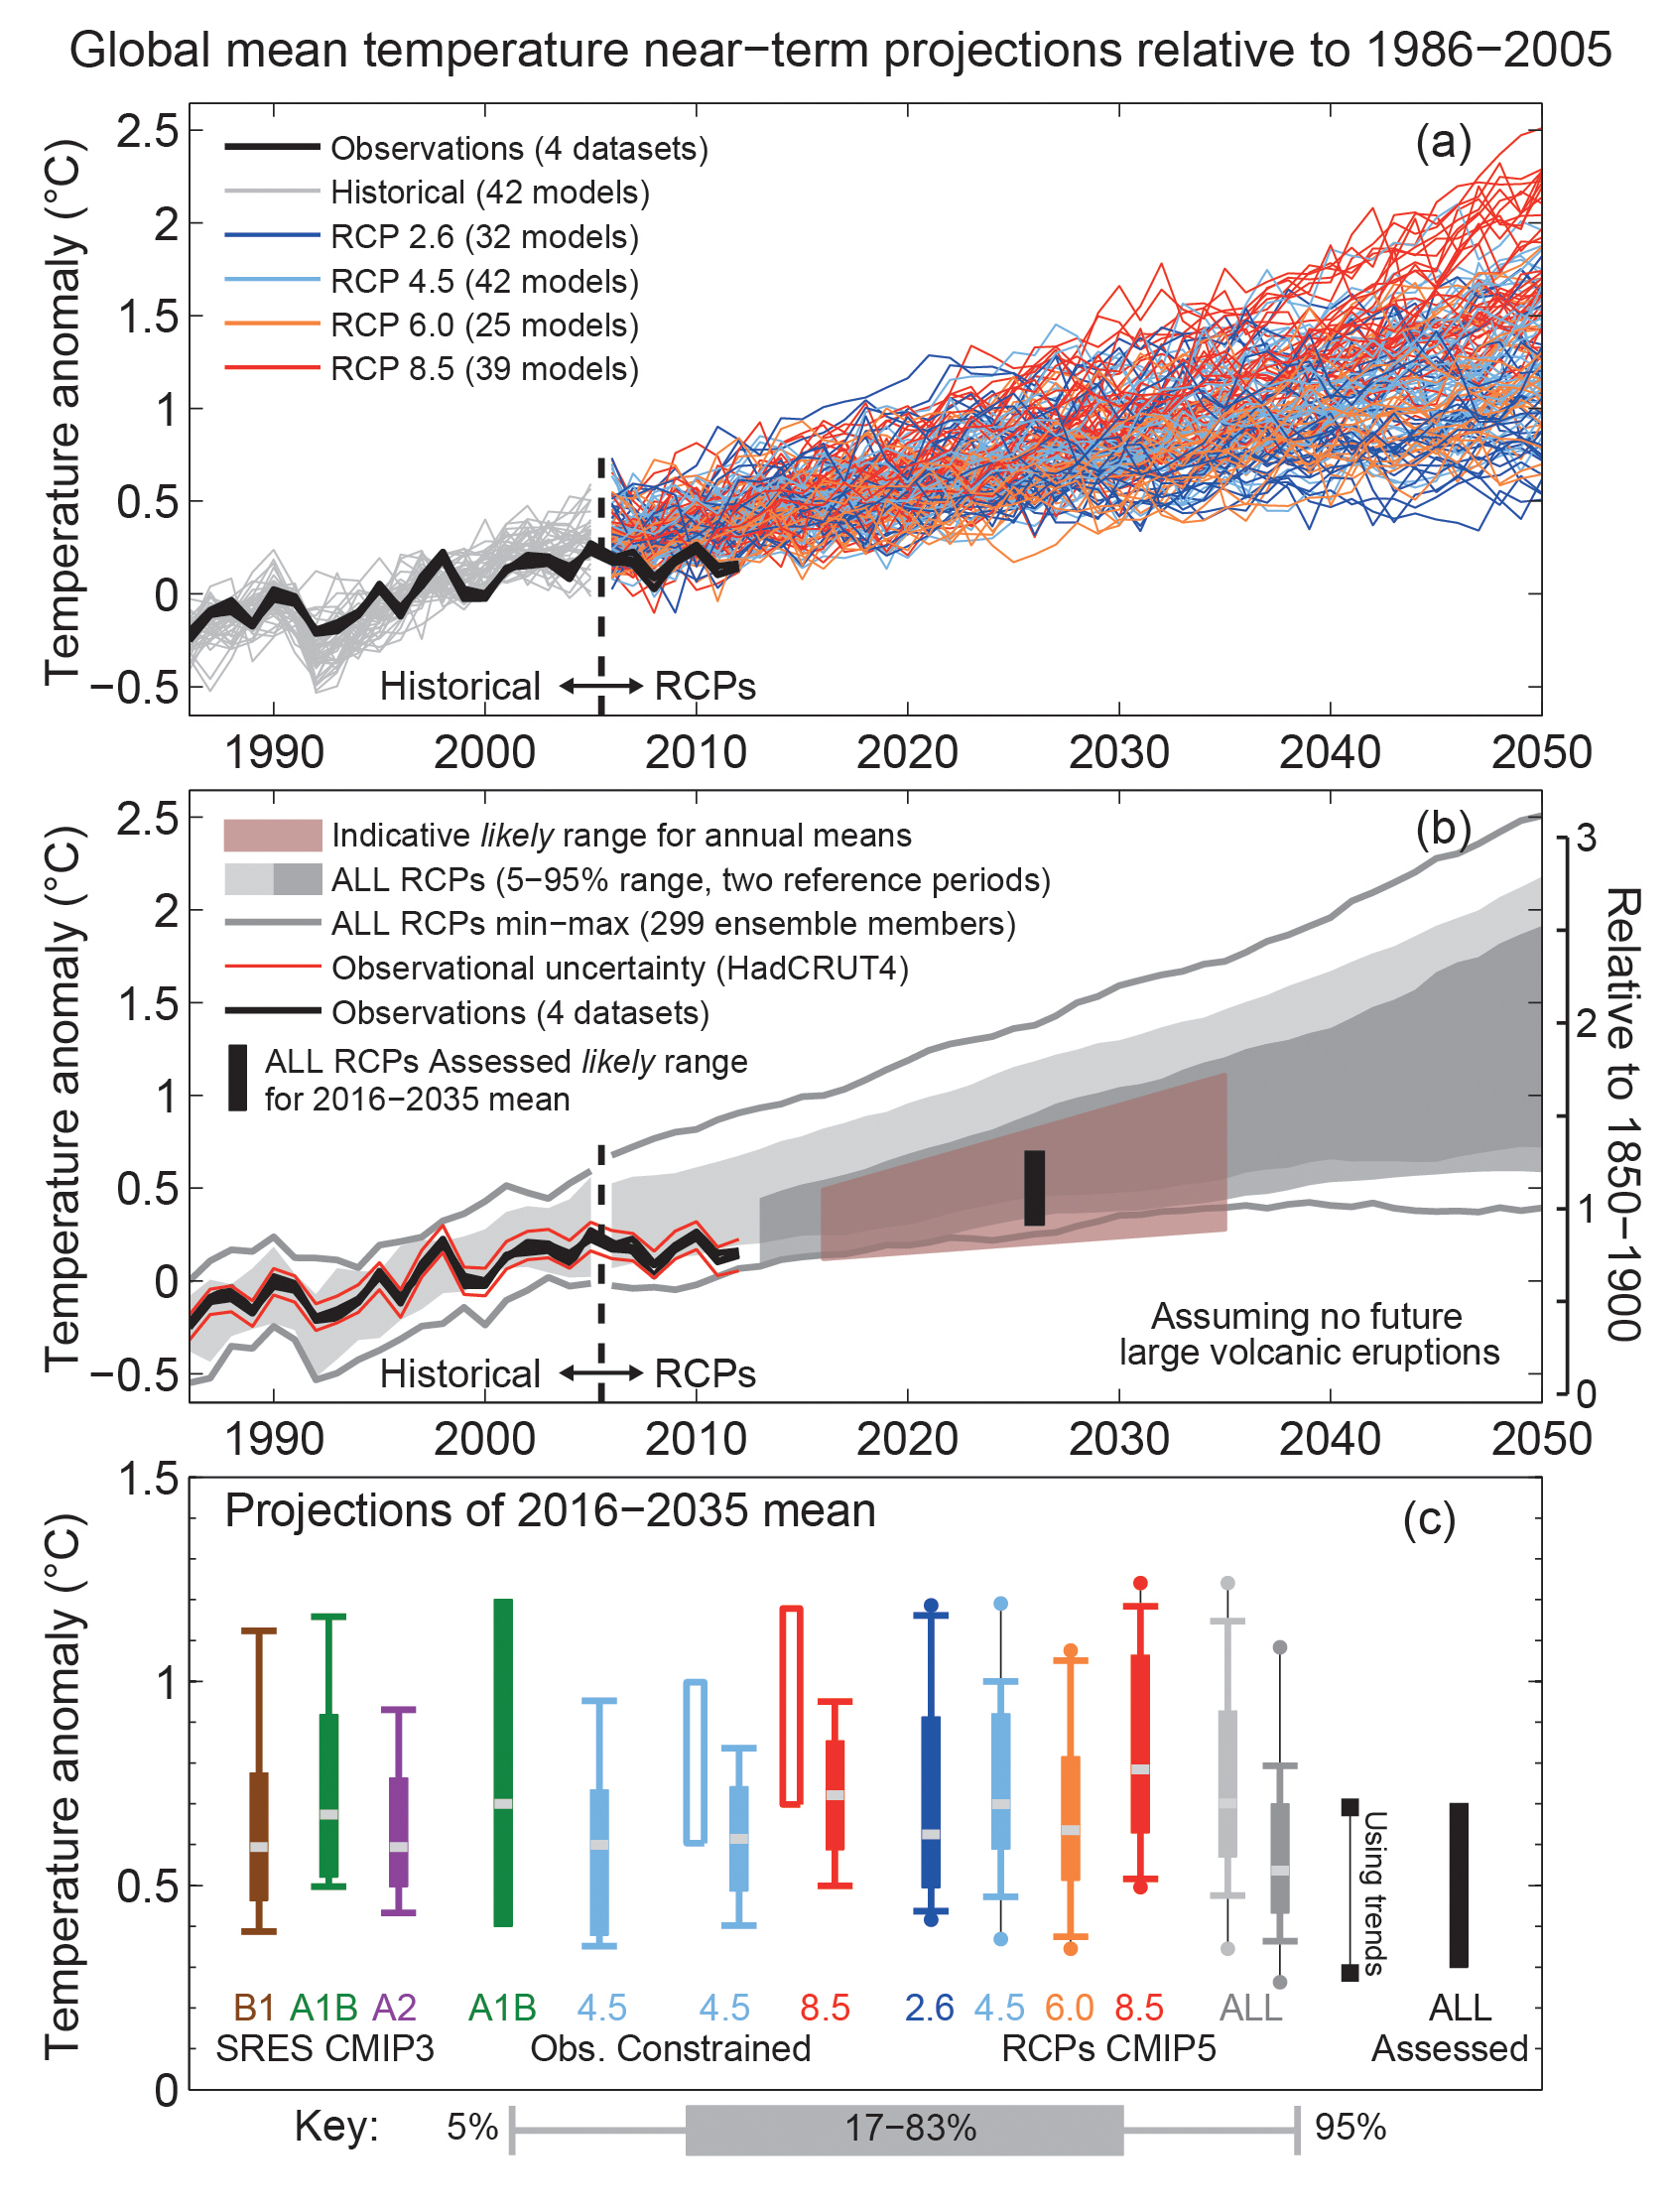
    When you study the actual measured data and the CMIP computer model projections it becomes clear that carbon dioxide (CO₂) has a relatively insignificant effect that no one has quantified accurately despite all the protestations that the science is settled. The IPCC AR5 reports (2013) demonstrated how much the computer model projections (RCPs) over-inflate temperature compared to measurements. Despite the obviously inaccurate projections, the RCP8.5 scenario—the most dire and unrealistic projection—is the one most quoted by climate alarmists and referenced in climate papers.


    See a more recent comparison of models to measurements here. According to measurements, even as global "action" on climate change is virtually non-existent, and what little there is has no meaningful effect on global temperature, the most realistic projection appears to be RCP2.6, which is the most benign. Natural climate variation and the theorized effects of Milankovitch cycles seem to dominate, but the science is far from understood because the global climate system is complex, non-linear, and chaotic.

    see: Milankovitch cycles (Wikipedia)

    Over the last million years the earth has cycled repeatedly through cold glacial periods and warm interglacial periods lasting approximately 100,000 years. We are in the warmest phase of the latest interglacial period that started about 12,000 years ago as the mile-thick glaciers covering most of the upper Northern Hemisphere began to melt, yet sea levels are still several meters lower than at the peak of the prior interglacial 125,000 years ago. All completely (or perhaps mostly) natural.


    see: Sea Level Rise, After the Ice Melted and Today (NASA GISS, January 2007)

    As the planet warms, life flourishes, and carbon locked up in the earth and seas begins to escape into the atmosphere, as it has several times before. Then a glacial period reverses the trend. After recovering from the Little Ice Age which ended in the mid-1800's, we are living in a serendipitously balmy period, ideally suited to life, but a lot of people are unhappy about it.


    see: Holocene Temperature Variations (Wikipedia)

    see: Little Ice Age (Wikipedia)

    Human CO₂ emissions undoubtedly are adding to the buildup in the atmosphere, but the amount of warming theorized by physics is negligible and logarithmic. That means it takes a doubling of CO₂ to theoretically raise temperature by 1° C. The pre-industrial CO₂ concentration is estimated to be about 280 ppm. We are just above 400 ppm, nowhere close to double yet.

    see: Global Monthly Mean CO₂ (NOAA ESRL)

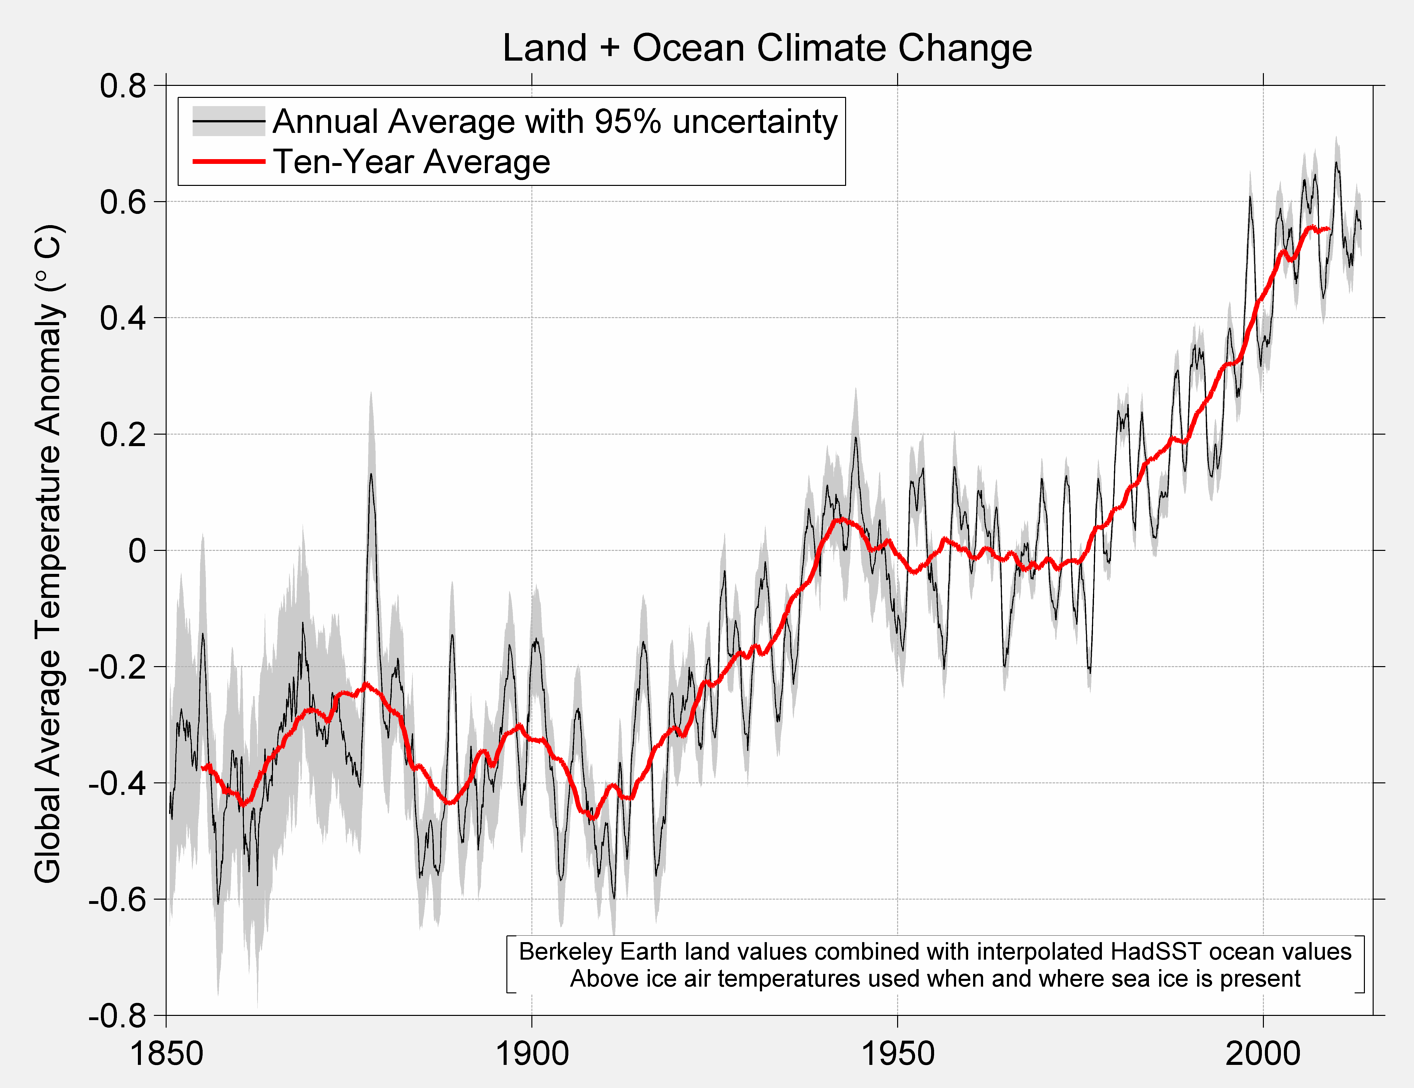
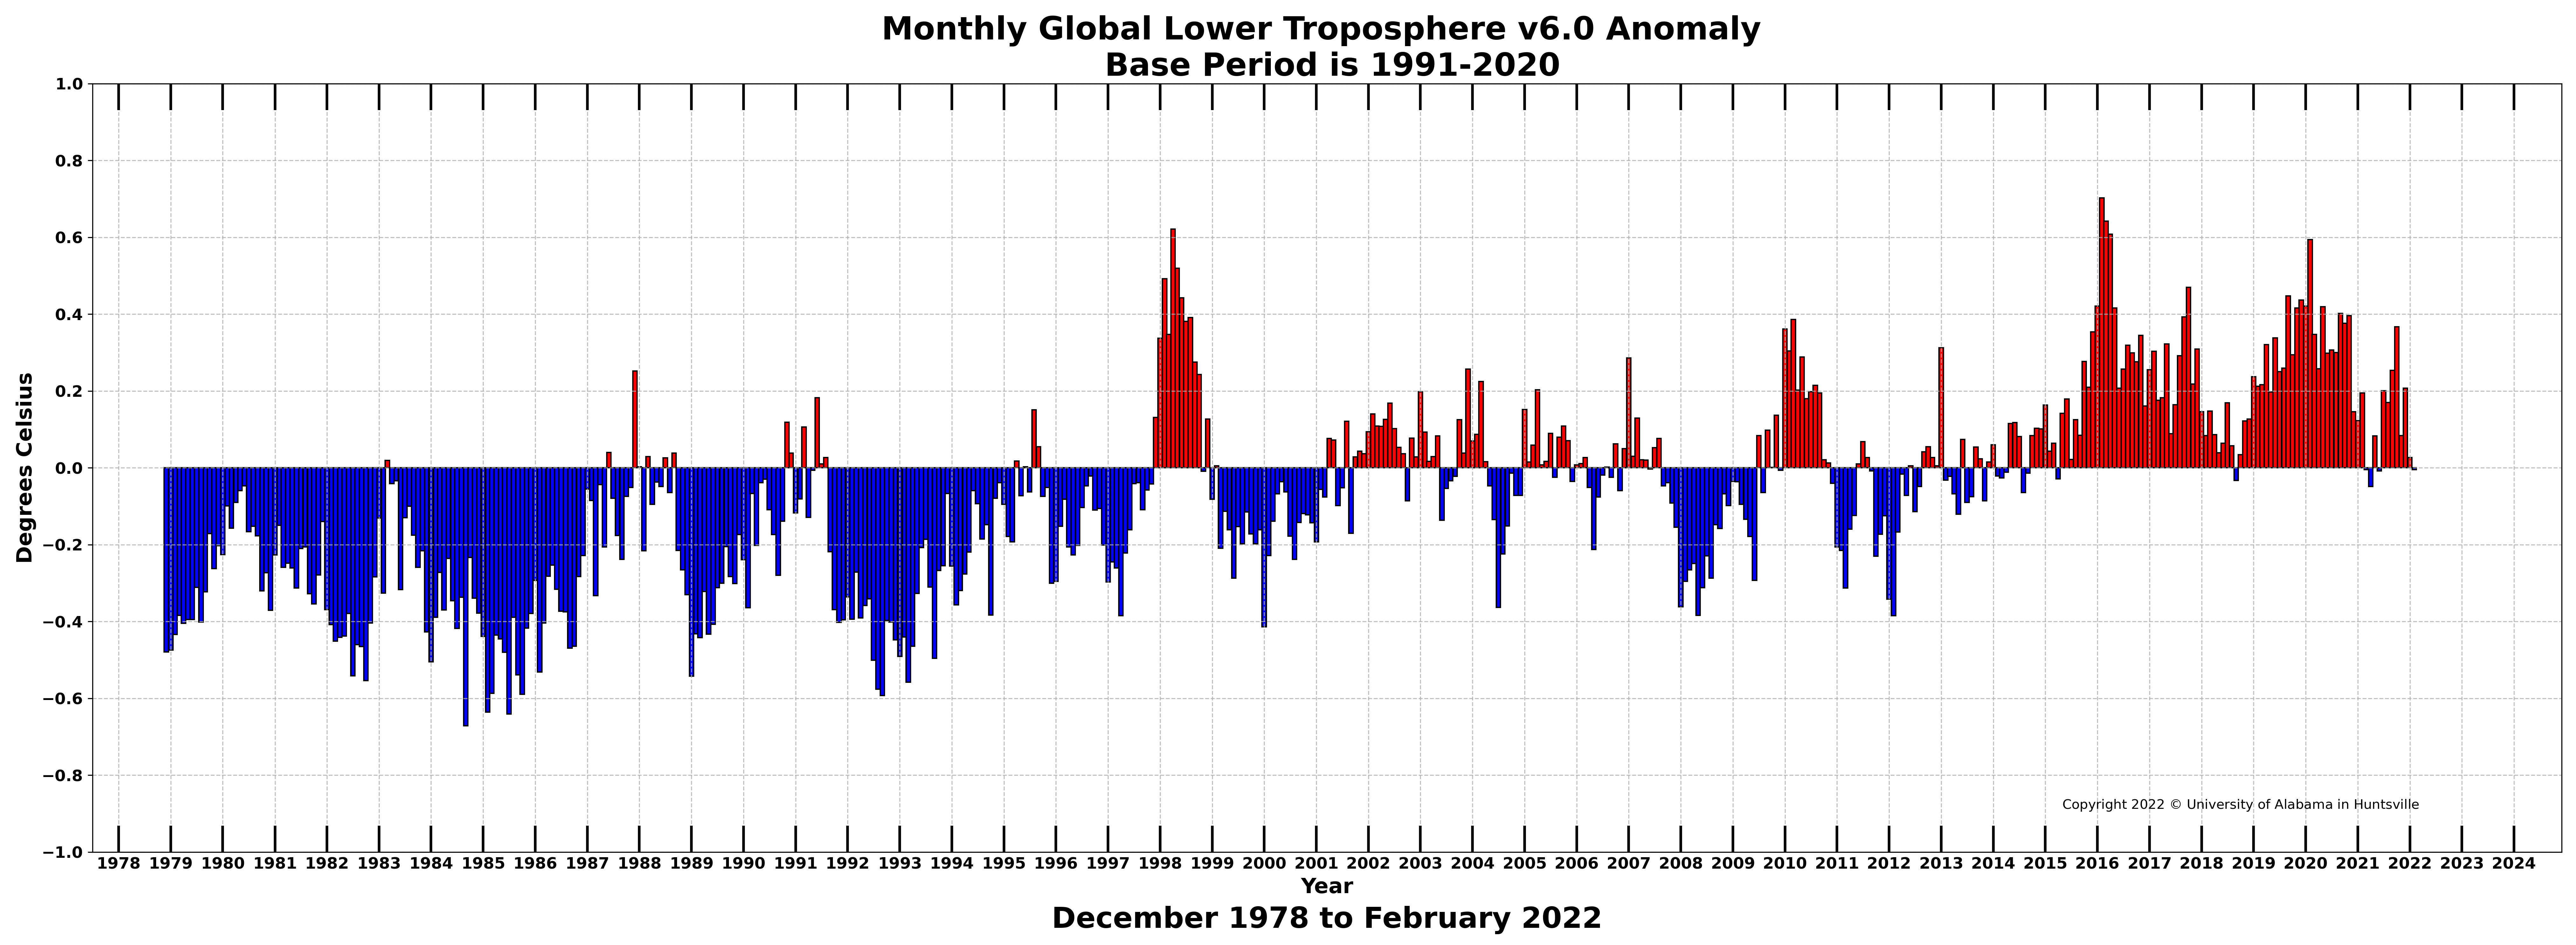
    According to statistical analysis of instrument data, global average temperature has risen about 1° C since the late 1800's and has slowed over the last 2 decades. Most of that temperature increase is natural. Roughly half occurred before the 1970's. That paltry 1° C is the temperature difference between ground level and 330 feet higher. Negligible.


    see: Global Temperature Report (UAH)

    Global temperature as of February 2022

    And global sea level rise is approximately 3 mm per year (measured by satellites; tide gauges show less) and has actually slowed slightly in the last few years, despite all the hue and cry about Greenland and Antarctic glacier melt.

    see: Global Mean Sea Level Time Series (University of Colorado)

    Incidentally, sea level rise varies by location. Marshy river deltas experience more due to land subsidence. In high northern latitudes sea level is actually going down due to post-glacial rebound after all those heavy mile-thick glaciers melted and the land rose.

    Tide gauge sea level trends

    Check your favorite seaside vacation spot here:

    see: Sea Level Trends (NOAA Tides & Currents)

    Based on actual measurements, not over-inflated computer models and all the wild claims made based on the models, it's easy to see that global warming hysteria is just that: hysteria. Have a look for yourself and don't worry, be happy.

    Wednesday, August 15, 2018

    Freedom on the decline in the U.S. Really?


    Oh, no! Freedom in the U.S. is declining! How do we know that? Freedom House says so. My favorite website for visualizing freedom around the world shows freedom in the U.S. declining starting in 2016. Hmmm....who was elected that year?

    Their reasoning is, to put it mildly, spurious. Okay, it's a crock of crap. Essentially it's a list of left-liberal talking points about Donald Trump and—without any evidence—how he has supposedly reduced freedom in the U.S.; and they have a survey of opinions to prove it! Those glorious opinions are so much more persuasive than facts and logic. The summary of why they reduced the score from 90 in 2016 to 86 in 2018 is:
    The United States’ political rights rating declined from 1 to 2 due to growing evidence of Russian interference in the 2016 elections, violations of basic ethical standards by the new administration, and a reduction in government transparency.
    Never mind that Russia has "interfered" in every U.S. election going back several decades but, as with the 2016 election, the evidence shows it has had no consequential effect. Freedom House ignores, of course, the incontrovertible evidence that the Clinton campaign colluded with Russians in a misinformation campaign ("opposition research") on then-candidate Trump, almost all of which was false.

    And whatever Trump's supposed "violations of basic ethical standards"—standards known only to Freedom House—they have not reduced freedom in the U.S. in any way whatsoever. That's the beauty of the Constitution's restrictions on government power, which, incidentally, haven't changed in—wait for it—over TWO CENTURIES, regardless of who has been elected President. Frankly, it's hard to imagine a worse violation of basic ethical standards than former President Obama conveying to Vladimir Putin through Russian president Dmitry Medvedev his "flexibility" to remove defensive missile installations from Poland after the 2012 election is over; high on Moscow's wish list to incapacitate its opponents. Obama won't do anything during an election year because it might hurt his chances at re-election as Americans see he kowtows to Moscow. He is the consummate politician: saying one thing to please the electorate while intending to do the opposite.

    The last point about a "reduction in transparency" is a flat out lie. President Trump has done exactly the opposite. He has increased government transparency and accountability, requiring agencies under his direction to be more forthright about their rule-making processes and—in the case of the EPA—publishing the the scientific studies they claim support their rules; something they never did before. President Trump has been a vocal and energetic advocate of "draining the swamp" in Washington D.C. and he is doing exactly that, despite the overwhelming bureaucratic and institutional inertia working against him.

    The upshot of Freedom House's arbitrary down-ranking of the U.S. is that countries which have essentially no protection for freedom of speech score higher than the U.S. (86), like Canada (99), Australia (98), New Zealand (98), the U.K. (94). The U.S. has arguably the strongest protection of freedom of speech of any democratic republic. It's enshrined in the FIRST amendment of the Constitution. There have been several recent high-profile cases in the U.K. (see also here) and Canada (also here and here) where people have been fined or have gone to jail because what they said was offensive to others. U.S. courts have repeatedly struck down defamation cases in deference to the First Amendment's protection of speech. So Freedom House puts the freedom score for the United States just above Poland (85), Mongolia (85), Romania (84), Ghana (83) and Argentina (83). Pretty funny, Freedom House.

    Contrary to the silly reasoning given by Freedom House, in the last 17 months, President Trump has increased accountability of the agencies under his direction and returned power to the people; power that was taken away by bureaucrats in those agencies under previous administrations. He has instituted an investigation of voter fraud; fraud which erodes the democratic process. He has increased health insurance choice and worked to reduce or remove tariffs on American goods by countries professing to favor free markets. He has strengthened support for NATO and our allies and aggressively acted to economically isolate the enemies of freedom like Iran, North Korea, and Russia. Yes, Russia.

    Here is a list of Trump accomplishments in the first 500 days in office. It's obvious that he has done much more to strengthen freedom in the United States and around the world than his predecessor. But you wouldn't know that from Freedom House.

    Friday, July 20, 2018

    Current Data on Climate Change

    Almost all the predictions about climate change are based on remarkably inaccurate computer-generated climate models, not on climate measurements. The predictions don't match measurements.

    See also here for more recent comparison of models to measured temperatures (June 2020).

    The best aggregate resource for current data and time series is at the Watts Up With That website Reference Pages. The website is skeptical of climate change claims, but the reference pages and graphs all link directly to the climate data of various climate science organizations.

    Here are a few links to websites of climate measurements, all from prominent scientific organizations.

    Global temperatures measured by satellite, 1979–present

    Global Temperature Report (UAH)

    Remote Sensing Systems (RSS) Upper Air Temperature Time Series

    RSS Air Temperature website

    Global temperatures measured by ground stations, 1850–present

    HadCRUT4 temperature

    NASA GISTEMP

    Berkley Earth Land and Ocean Data

    NOAA Global Time Series

    NOAA National (U.S.) Temperature Index Time Series

    Global sea level rise measured by satellite, 1993–present

    Global Mean Sea Level Time Series (CU)

    Global sea level rise measured by tide gauges, 1807–2013

    NASA Vital Signs: Sea Level (satellite and tide gauge)

    Tide Gauge Sea Level (CU)


    Climate Predictions are Based on Computer Models

    It is not widely understood that almost all the dire predictions about climate change are based on computer-generated climate models, not on measurements of climate phenomenon. Here's a sample of publications:


    The last two are massive reports widely accepted as accurate summaries of the current (at the time) state of climate science. All of their future predictions are derived from climate models, not projections of current measured trends.

    Once you start to notice that the studies and news articles predicting some impending disaster from global warming often state something like "models predict..." or "based on GCM (Global Circulation Models) analysis..." or "CMIP simulations show...", you start to get a nose for sniffing them out and it becomes apparent that they are not studying measurements of global climate, they are studying climate simulations on computers.

    The CMIP5 simulations used in all these studies are, to put it mildly, inaccurate. Modeling something as chaotic and complex as the global climate isn't just a daunting task, it's impossible. As the IPCC AR5 report mentions in the glossary, "because the climate system is inherently nonlinear and chaotic, predictability of the climate system is inherently limited" (p.1460). IPCC AR5 has a graph on page 87 of the Technical Summary (PDF) showing results of CMIP5 simulations compared to global temperature measurements:

    Figure TS.14, p.87 from IPCC Fifth Assessment Report (AR5, 2013)

    You can see how quickly they diverge. (See more recent comparison here.) The climate models are based on the assumption that CO2 is the main driver of global warming so they have been built to model that, then refined to try and accurately represent recent warming prior to the 21st century. That's why they appear to track fairly closely to the measured warming over the prior 2 decades. But by 2007 you can see that they all predict more warming than is actually happening and they get worse over time. The CMIP5 temperature predictions go up steadily but measured global temperatures have not. There was a warming "hiatus" between 1998 and 2016.


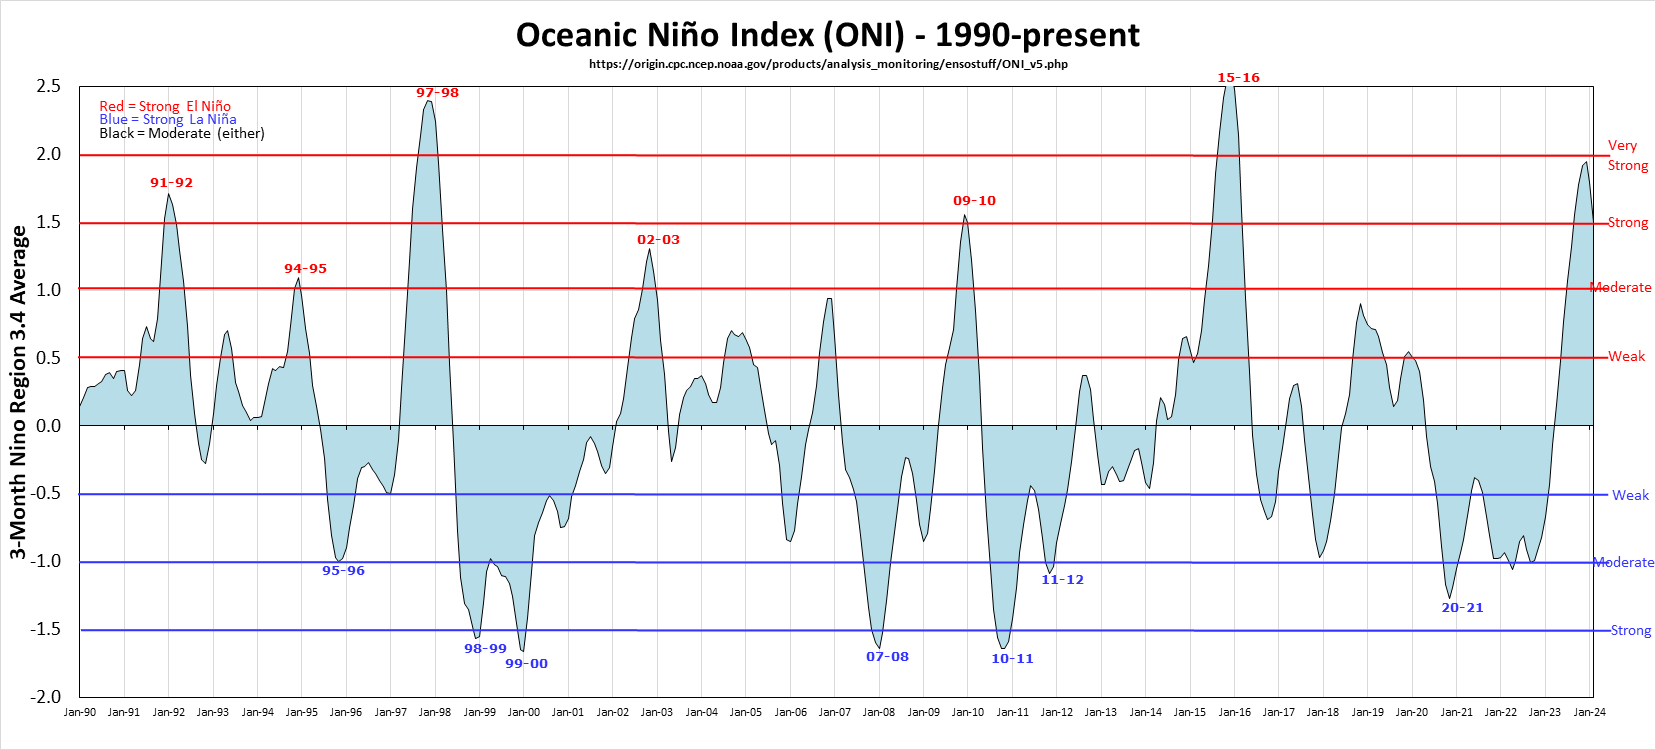
    If you have trouble seeing that there has been essentially no warming between 1998 and 2016 just draw a horizontal line at the peak temperature in 1998 and notice that none of the subsequent years came anywhere close to 1998 until 2016. Coincidentally, 1998 and 2016 were years that had unusually large El Niños which you can see graphed here:

    Oceanic Niño Index as of January 2022


    The UK Met Office, one of the leading research institutions on global climate, has a helpful video explaining what the El Niño Southern Oscillation is. The U.S. NOAA has a video showing typical El Niño impacts on the United States. It appears that the influence on global temperatures of those large El Niños far outpaces any possible human contribution.

    Despite confident assurances by climate scientists that global warming will continue indefinitely unless we do something to limit global CO2 emissions, the global average temperature has remained fairly steady over the last 20 years. It should be obvious that the results of any studies based on the CMIP5 models should be viewed with healthy skepticism.

    Wednesday, June 27, 2018

    Yet Another Sea Level Rise Apocalypse Not Happening

    Some people like a suspenseful, scary story more than they like reality.

    Rising seas: 'Florida is about to be wiped off the map' (The Guardian, 2018-06-26)

    Coastal areas of Florida may eventually succumb to rising seas...in hundreds of years.

    Perspective (and Data) Changes the Story

    Check the NOAA Tides & Currents: Sea Level Trends map to see what local sea level rise is. In Florida it varies between about 2.1 and 3.7 mm/yr. The variation has a lot to do with land subsidence. The land in some areas—especially swampy areas or areas where groundwater is being depleted—is subsiding, adding to sea level rise. (In high northern latitudes the reverse is happening. The land is rising; rebounding from the massive glaciers that used to cover most of it.)

    Hal, the geologist in the article frightening the handful of gullible folks who show up to see his dog and pony show, should know this but he probably enjoys the attention he gets from telling scary stories.

    If you use an average of 2.7 mm/yr for the 15 stations in Florida it will take 370 years for sea levels to rise 1 meter (3.28 feet). That's not much and adapting to it isn't difficult if you have hundreds of years to adjust. Just ask the Dutch who have been reclaiming land from the sea for centuries by building dikes and draining the sea.

    The story mentions that half the population of Florida lives less than 6 ½ feet (2 meters) above high tide. It will take 740 years for sea level to rise 2 meters. Florida is not "about to be wiped off the map". But the progeny of the current population, 32 generations from now, may have to move inland a little. Unless they do like the Dutch and engineer some practical solutions.
    the (IPCC) expects roughly two feet of rise by century's end. And the (NOAA) estimates an upper limit of six and a half feet.
    Yeah, but those guesses aren't based on real-world measurements. They're from computer models which are demonstrably inaccurate. The latest report, IPCC AR5, was published in 2013. In 87 years, at the current rate (depending on how you measure, by satellite or tide gauge), sea levels will have risen 148 to 278 mm (5.8 to 11 inches). That's a whole lot less than two feet. Or six and a half feet.
    The rate of sea level rise is currently doubling every seven years
    No it's not. In fact it appears to be doing the opposite: slowing down. You can see for yourself from the data collected by NOAA and other research organizations. NOAA and NASA keep decreasing the average rate of sea level rise they publish, from over 3.4 to 3.2 to now 3.1 mm/yr. How did Hysterical Hal come up with "doubling every seven years"?

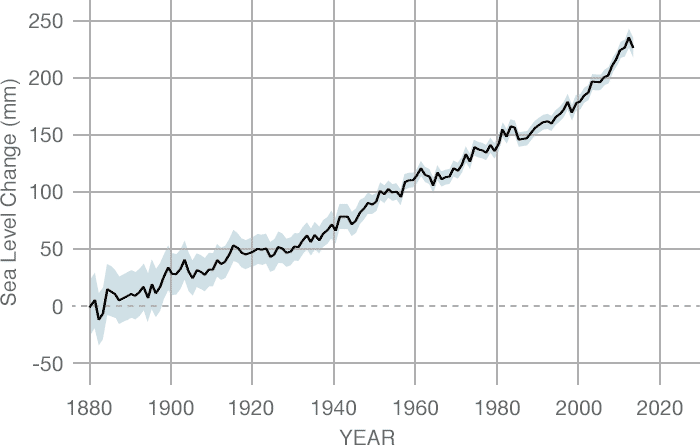
    Look at the University of Colorado's Sea Level Research Group data on sea level rise. And here are graphs from NASA's website of sea level rise measured by satellite and tide gauges.

    Sea Level from Satellite Telemetry, 1993–2018. Rate is 3.2 mm/yr.

    Sea Level from Tide Gauge Data, 1870–2013. Rate is 1.7 mm/yr.

    The tide gauge data goes back almost 150 years. There appears to be an increase in rate starting about 1930, but only because there was no sea level rise over the prior two decades. The rate since 1930 shows no appreciable increase. The tide gauge graph shows a rate increase after 2000, but the satellite data does not. The discrepancies between the rates measured by tide gauges and satellites has nothing to do with sea level rise itself. It has to do with the accuracy of the instruments and statistical methods used to aggregate the data.

    It's All About Context

    From 1900 to 2000 the glacier on the screen retreated inward eight miles. From 2001 to 2010 it pulled back nine more; over a single decade the Jakobshavn glacier lost more ice than it had during the previous century. 
    Sure, but missing important context. Glaciers retreat in response to warming air temperatures. They also retreat due to lack of precipitation (snow), geothermal warming under the glacier, meltwater running under the glacier, and how much of the tongue of the glacier extends into the ocean and the temperature of that water.  Jakobshavn is a dramatic example of a glacier losing mass; however there are glaciers in Alaska that have grown in size (Taku Glacier) while nearby glaciers have retreated, highlighting the fact that many factors affect glacier mass.  Changes in size (Columbia Glacier) do not necessarily correspond to global temperature changes.
    “Greenland is currently calving chunks of ice so massive they produce earthquakes up to six and seven on the Richter scale,” Hal says as the city of ice breaks apart. “There was not much noticeable ice melt before the nineties. But now it accelerates every year, exceeding all predictions. It will likely cause a pulse of meltwater into the oceans.”
    A favorite tactic of doomsayers and storytellers: paint an eye-catching visual image to highlight the drama, but leave out the context.

    Greenland and Antarctica have been calving massive ice chunks for thousands of years but no one noticed because no one was around to notice. Now we have an increasing number of instruments and survey teams observing these events. The mass of the Greenland ice sheet has been measured regularly by satellite for only about 20 years now. We don't know how much it gained or lost mass over the preceding decades so we have no basis for making predictions. Ancient trees and forests are being uncovered under receding glaciers in Europe and North America. Glaciers in many places had receded more several thousand years ago than they have now; enough that forests thrived. To say ice loss "accelerates every year, exceeding all predictions" isn't a scientific statement. It's hyperbole. 

    The bottom line, the measurement that matters, is sea level rise. That's what will affect people in Florida and all over the world who live in low-lying coastal areas. Despite all the claims of accelerating ice loss in Greenland and Antarctica, we don't see the supposedly accelerating ice loss noticeably affecting measurements of sea level rise.

    More Context

    And speaking of context, it should be no surprise that glaciers have generally decreased in mass globally in recent history because they've been doing so for the last 12,000 years since natural warming started melting the massive, mile-thick glaciers that covered much of the upper Northern Hemisphere.


    If you go back before the previous glacial period to the peak of the prior interglacial (warm) period 125,000 years ago, sea level was 4 to 6 meters higher than now (13 to 20 feet). At the current rate, that will take another 1,600 to 2,400 years.

    And Even More Context

    If you really want some context, sea levels were 120 meters (394 feet) lower about 20,000 years ago at the coldest point of the last glacial period before the earth started warming and the continent-sized glaciers began to melt. The earth has experienced warming and cooling periods several times over the last million years, each lasting roughly 100,000 years with 25° C (45° F) global temperature variations and sea level changes of 125 meters (410 feet).


    Notice that in the last 3 cycles the cold glacial periods lasted much longer than the relatively brief warm periods. We should be ecstatic that we don't live in a glacial period.

    No one knows what causes these large-scale climate changes but Milankovitch Cycles are a leading contender. We live on a remarkable and dynamic planet.
    Friday, March 23, 2018

    Media Disinformation on Operation Epic Fury in Iran

    If you think that Operation Epic Fury in Iran, launched just over 2 weeks ago on February 28, is a major blunder, you can blame the legacy m...