Showing posts with label climate data. Show all posts

Saturday, May 14, 2022

Sea Level Perspectives

We are told by the media and other climate alarmists that sea level rise is unprecedented, disastrous, and accelerating, but measurements by tide gauges and satellites show us something completely different. Here is a plot of current (29-year) global sea level rise measured by satellites. (See here for the latest.)

Here is a plot of sea level rise for more than 160 years at Battery Park in Manhattan, New York; one of the longest tide gauge records available anywhere in the world. (See here for the latest.)

Sea level has been rising for roughly 18,000 years since the last glacial maximum when the two-mile-thick glaciers covering huge swaths of North America and northern Europe and Eurasia began to melt. Here is a plot of global sea level over the last 18,000 years.

120 meters of sea level rise is 394 feet. This cycle of global warming and cooling has happened several times over the last million years or so. Here is a reconstruction of sea levels over the last 1.8 million years based on the content of the isotope oxygen-18 in deep ocean sediments.

The important points:

  • Global sea level rise and fall has been happening for billions of years.
  • The rate of sea level rise and fall changes for numerous reasons, all entirely natural.
  • What causes global warming and cooling and the subsequent glacial and interglacial periods isn't fully understood, though Earth's periodic orbital changes over tens of thousands of years is among those postulated to have the greatest effect. 
  • The current rate of sea level rise is insignificant when viewed in historical context.
  • It is impossible to measure the theorized effect humans have on sea level rise but the rate is so small compared to natural forces as to be inconsequential. 
  • Based on measurements, the claims of 0.6 meters or more of sea level rise by 2100 are clearly unrealistic. The current rate measured by satellites suggest about 0.3 meters. It's even less according to the rate measured by tide gauges.

Humans have been dealing with sea level rise for thousands of years. The Dutch and others have successfully protected their land from sea level rise and even reclaimed land from the sea thanks to clever engineering. Humans can adapt to the current rate of sea level rise with the same clever engineering. The cost of doing this is far less than starving the world of fossil fuels and destroying economies in a vain attempt to "stop" global warming.

You can see for yourself what the current rate of satellite measured global sea level rise is at the University of Colorado Sea Level Research Group website.

Global Mean Sea Level (GMSL) measured by satellite 

Historical Global Tide Gauge Sea Level

Sea level rise, and sea level decline in many place in the far north, is not uniform. It differs a lot because of land subsidence and uplift (post-glacial rebound). You can easily see it in this interactive map of tide gauge data from NOAA.

Sea Level Trends

The tectonic forces, gravitational perturbations, and even potential influences from beyond our solar system over the eons that shape our planet and its climate and weather are endlessly fascinating, but they happen so slowly that the ingenuity of millions of humans engineering solutions to their local problems can easily adapt to it. Beware of "global" solutions. They are always, without exception, a really bad idea with a plethora of destructive consequences.

Tuesday, November 19, 2019

Climate science: models versus measurements

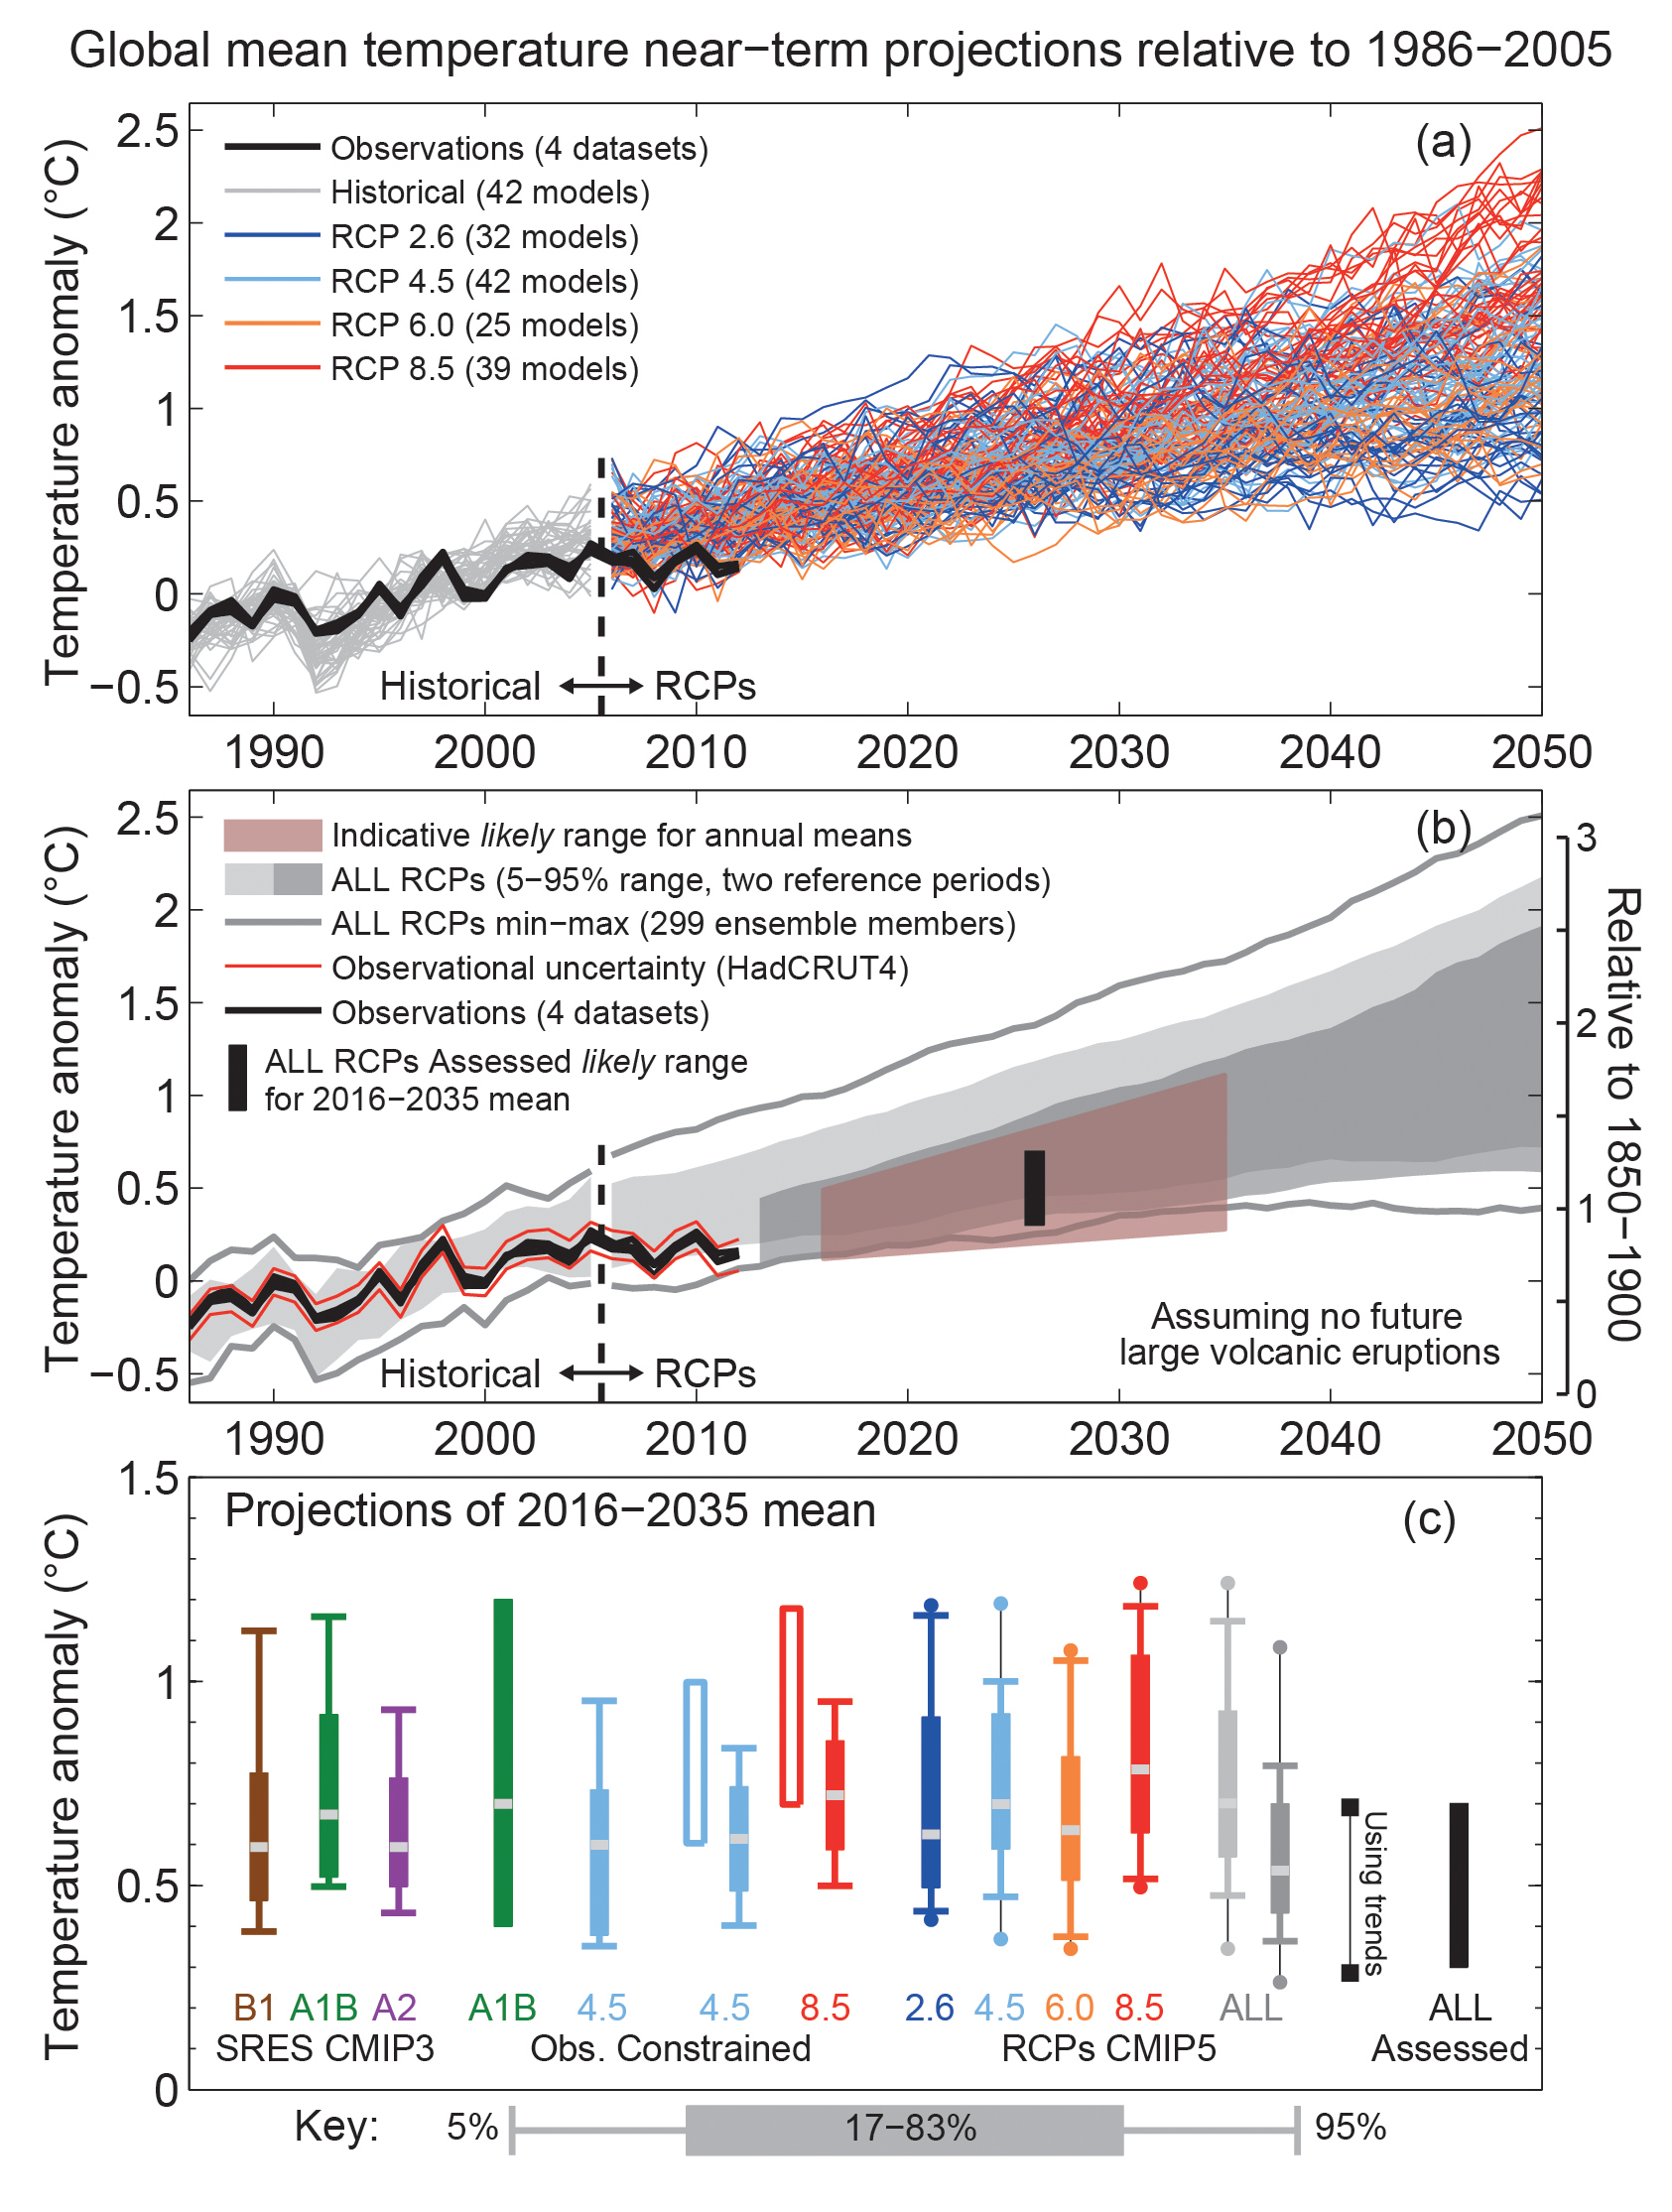
When you study the actual measured data and the CMIP computer model projections it becomes clear that carbon dioxide (CO₂) has a relatively insignificant effect that no one has quantified accurately despite all the protestations that the science is settled. The IPCC AR5 reports (2013) demonstrated how much the computer model projections (RCPs) over-inflate temperature compared to measurements. Despite the obviously inaccurate projections, the RCP8.5 scenario—the most dire and unrealistic projection—is the one most quoted by climate alarmists and referenced in climate papers.


See a more recent comparison of models to measurements here. According to measurements, even as global "action" on climate change is virtually non-existent, and what little there is has no meaningful effect on global temperature, the most realistic projection appears to be RCP2.6, which is the most benign. Natural climate variation and the theorized effects of Milankovitch cycles seem to dominate, but the science is far from understood because the global climate system is complex, non-linear, and chaotic.

see: Milankovitch cycles (Wikipedia)

Over the last million years the earth has cycled repeatedly through cold glacial periods and warm interglacial periods lasting approximately 100,000 years. We are in the warmest phase of the latest interglacial period that started about 12,000 years ago as the mile-thick glaciers covering most of the upper Northern Hemisphere began to melt, yet sea levels are still several meters lower than at the peak of the prior interglacial 125,000 years ago. All completely (or perhaps mostly) natural.


see: Sea Level Rise, After the Ice Melted and Today (NASA GISS, January 2007)

As the planet warms, life flourishes, and carbon locked up in the earth and seas begins to escape into the atmosphere, as it has several times before. Then a glacial period reverses the trend. After recovering from the Little Ice Age which ended in the mid-1800's, we are living in a serendipitously balmy period, ideally suited to life, but a lot of people are unhappy about it.


see: Holocene Temperature Variations (Wikipedia)

see: Little Ice Age (Wikipedia)

Human CO₂ emissions undoubtedly are adding to the buildup in the atmosphere, but the amount of warming theorized by physics is negligible and logarithmic. That means it takes a doubling of CO₂ to theoretically raise temperature by 1° C. The pre-industrial CO₂ concentration is estimated to be about 280 ppm. We are just above 400 ppm, nowhere close to double yet.

see: Global Monthly Mean CO₂ (NOAA ESRL)

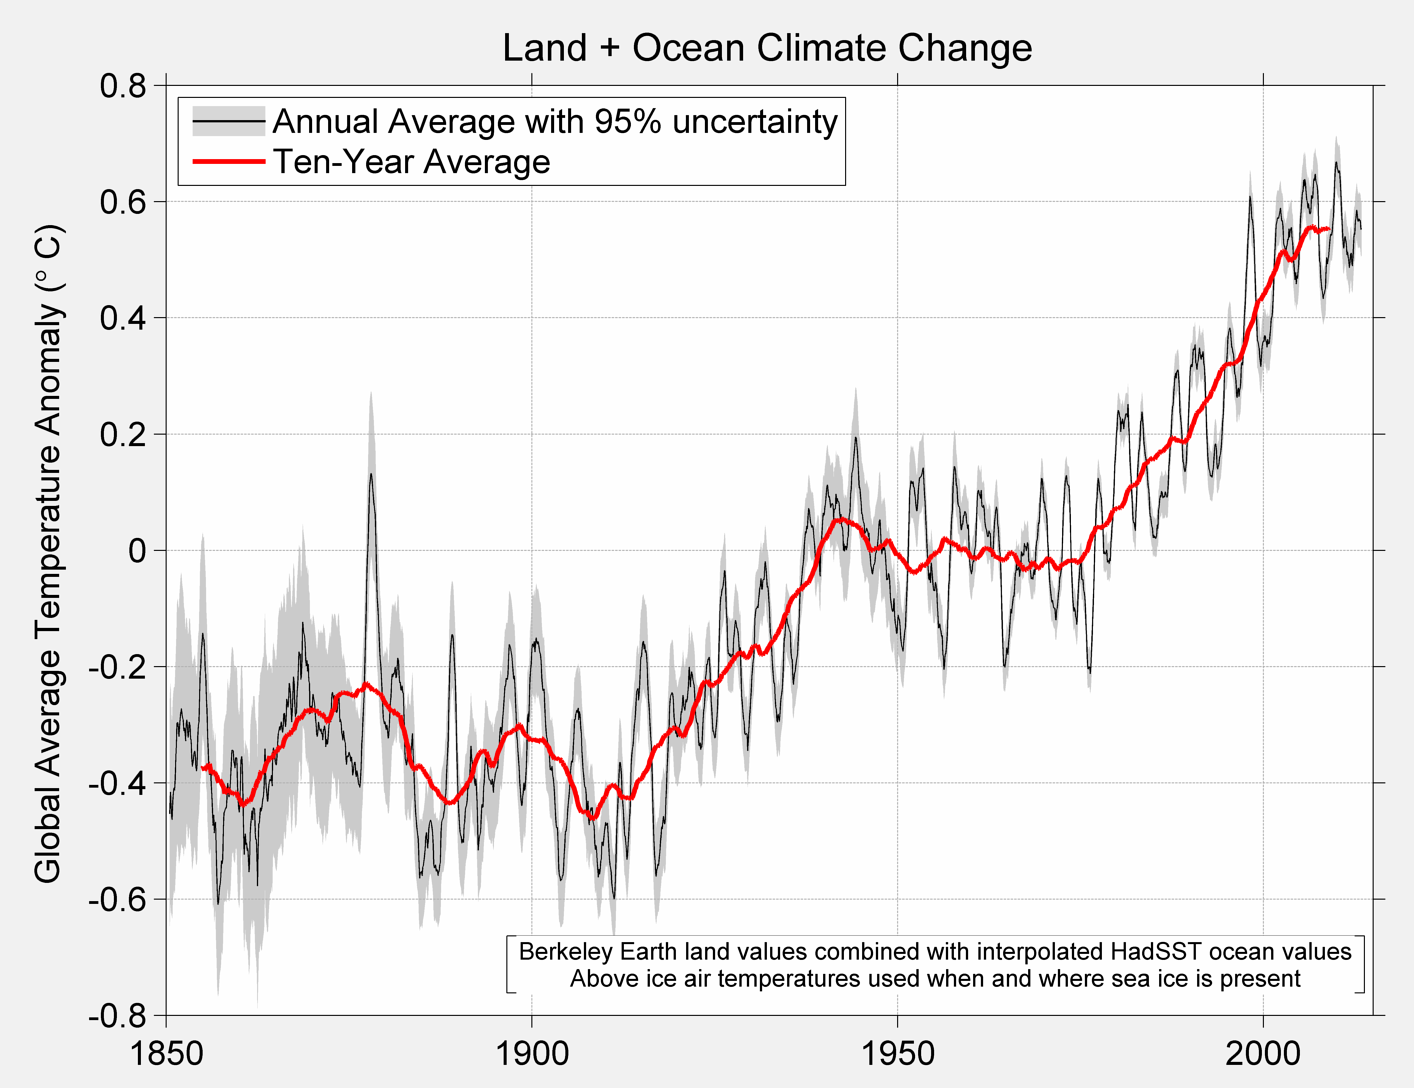
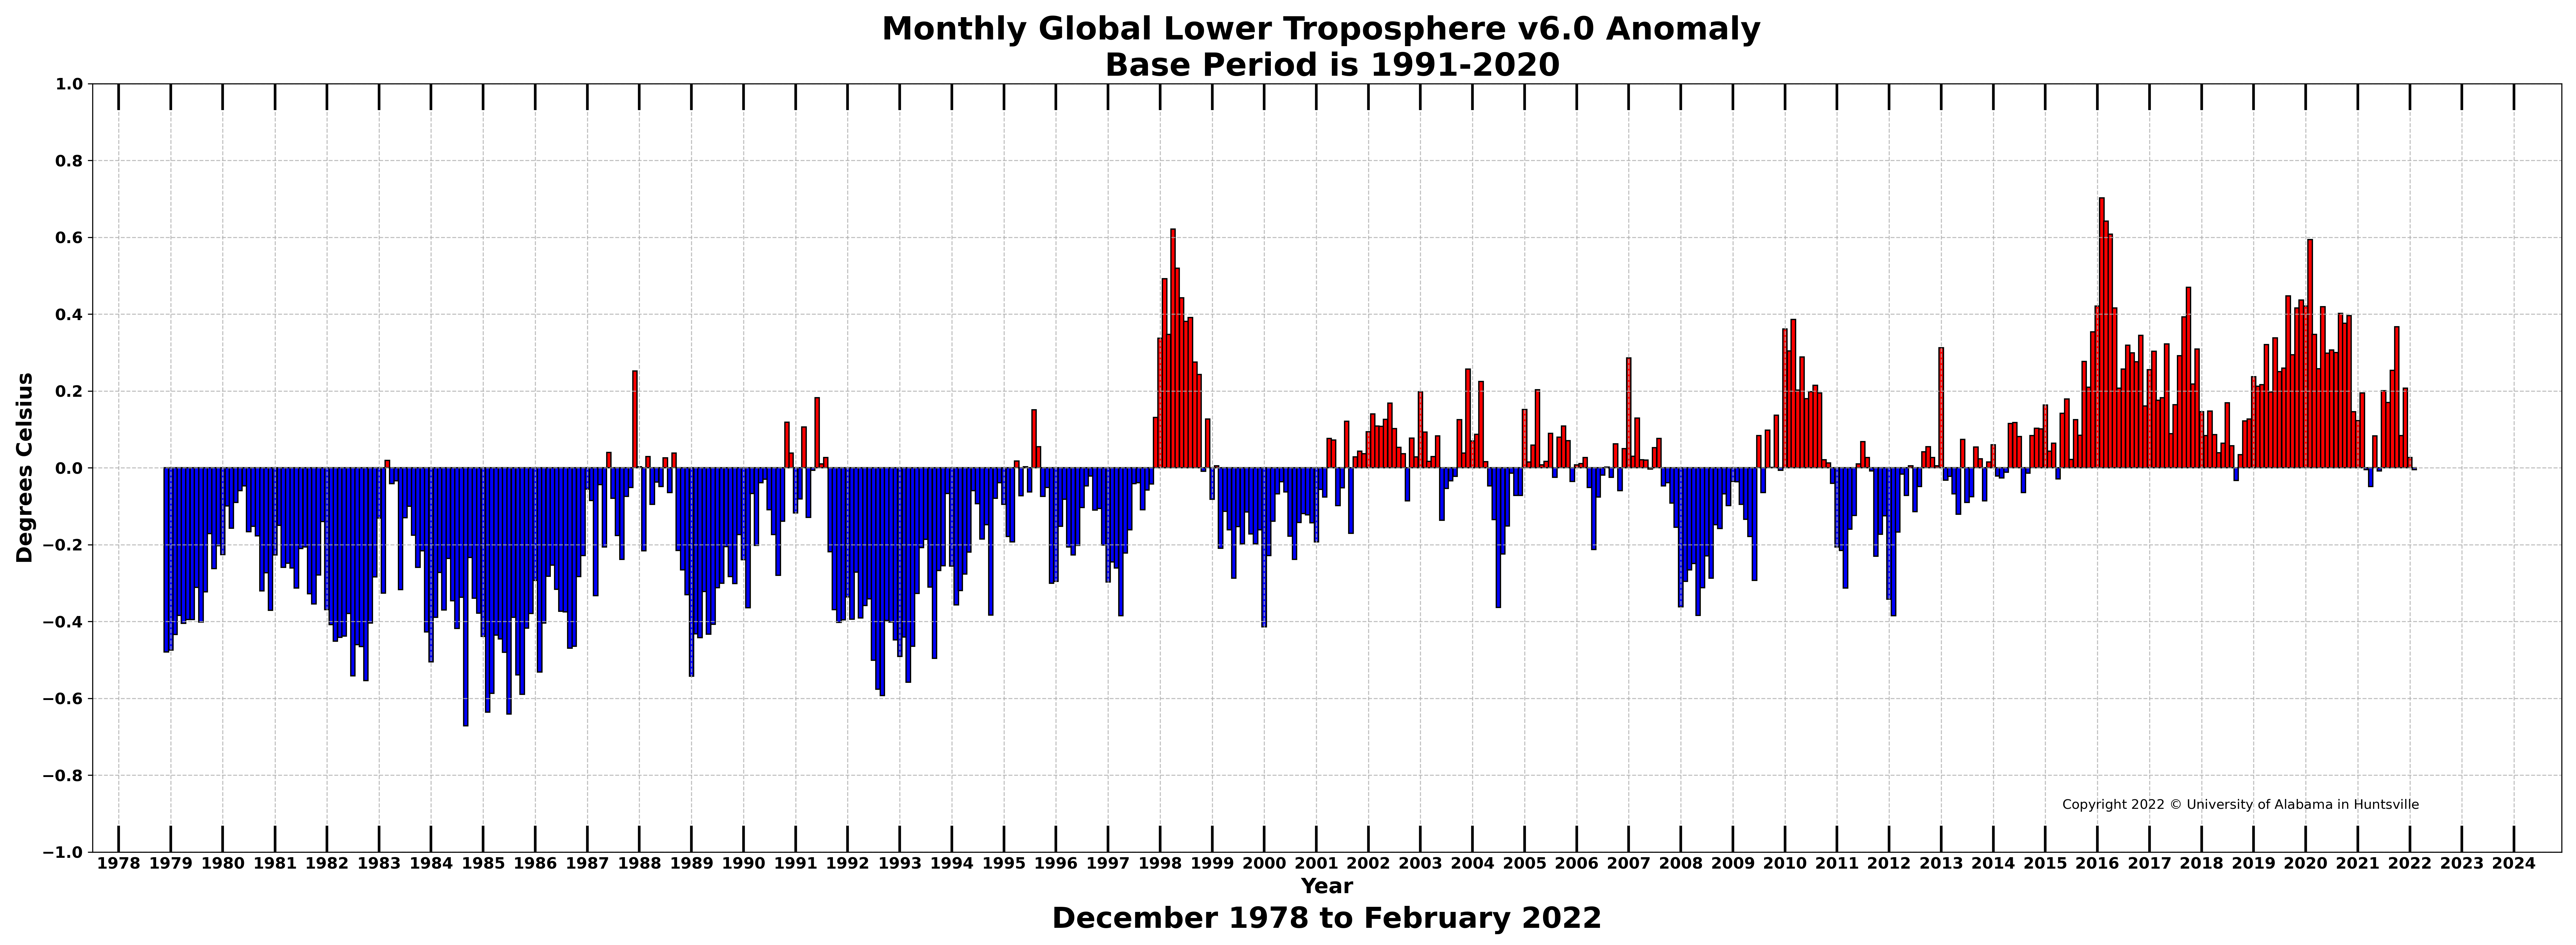
According to statistical analysis of instrument data, global average temperature has risen about 1° C since the late 1800's and has slowed over the last 2 decades. Most of that temperature increase is natural. Roughly half occurred before the 1970's. That paltry 1° C is the temperature difference between ground level and 330 feet higher. Negligible.


see: Global Temperature Report (UAH)

Global temperature as of February 2022

And global sea level rise is approximately 3 mm per year (measured by satellites; tide gauges show less) and has actually slowed slightly in the last few years, despite all the hue and cry about Greenland and Antarctic glacier melt.

see: Global Mean Sea Level Time Series (University of Colorado)

Incidentally, sea level rise varies by location. Marshy river deltas experience more due to land subsidence. In high northern latitudes sea level is actually going down due to post-glacial rebound after all those heavy mile-thick glaciers melted and the land rose.

Tide gauge sea level trends

Check your favorite seaside vacation spot here:

see: Sea Level Trends (NOAA Tides & Currents)

Based on actual measurements, not over-inflated computer models and all the wild claims made based on the models, it's easy to see that global warming hysteria is just that: hysteria. Have a look for yourself and don't worry, be happy.

Friday, July 20, 2018

Current Data on Climate Change

Almost all the predictions about climate change are based on remarkably inaccurate computer-generated climate models, not on climate measurements. The predictions don't match measurements.

See also here for more recent comparison of models to measured temperatures (June 2020).

The best aggregate resource for current data and time series is at the Watts Up With That website Reference Pages. The website is skeptical of climate change claims, but the reference pages and graphs all link directly to the climate data of various climate science organizations.

Here are a few links to websites of climate measurements, all from prominent scientific organizations.

Global temperatures measured by satellite, 1979–present

Global Temperature Report (UAH)

Remote Sensing Systems (RSS) Upper Air Temperature Time Series

RSS Air Temperature website

Global temperatures measured by ground stations, 1850–present

HadCRUT4 temperature

NASA GISTEMP

Berkley Earth Land and Ocean Data

NOAA Global Time Series

NOAA National (U.S.) Temperature Index Time Series

Global sea level rise measured by satellite, 1993–present

Global Mean Sea Level Time Series (CU)

Global sea level rise measured by tide gauges, 1807–2013

NASA Vital Signs: Sea Level (satellite and tide gauge)

Tide Gauge Sea Level (CU)


Media Disinformation on Operation Epic Fury in Iran

If you think that Operation Epic Fury in Iran, launched just over 2 weeks ago on February 28, is a major blunder, you can blame the legacy m...